
Air Monitoring Q&A
Learn more about the IVAN Air Monitoring network and data below.
About IVAN Air Monitoring
This network was developed in response to the community residents’ concerns about air quality and their desire for more neighborhood-level data. The network was designed with significant input and decision-making from community residents, while incorporating technical priorities to ensure scientific integrity. To our knowledge, it is the first community-designed network of its size in the world.
Our network measures air quality at additional locations throughout the county. Our monitors are different from government monitors and cannot be used to assess if air pollution levels are within legal limits. But they provide other important information. For example, community members can find out current air quality at a specific location and see recommended actions to protect health. Air quality data from our monitors can also be used for research and to inform activities aimed at improving health and the environment for Imperial County communities. Learn more about how data from our monitors differ from government monitoring data.
To ensure that the network was responsive to community needs, all activities are guided by a Community Steering Committee of community leaders and concerned residents from Imperial County. Additionally, community residents from over 11 cities and towns throughout the county participated in a two-day process to identify and prioritize where to place the air monitors. Finally, CCV staff received technical training to install, operate, and conduct maintenance on the monitors.
About the data
Each monitor has a detailed data webpage that provides more information about what air quality is usually like at that location. For example, for each location, you can see the average air quality for the past 24 hours, past 30 days, and past 90 days. Air quality data are provided as CALs and as particulate matter (PM) concentrations. The data on this website are automatically reported from the monitors and have not been verified or validated, so should be considered preliminary and used with discretion.
- Find out the current air quality at one of the many monitor locations
- Take action as needed to reduce air pollution exposure for yourself and your loved ones
- Examine how particulate matter (PM) air pollution varies within the county
Data from IVAN Air Monitoring cannot be used to determine if air quality standards are being met. Only data from government regulatory monitors can be used to determine if air quality standards are being met.
Aside from differences between the monitors themselves, there are a number of other reasons that data from IVAN Air Monitoring may differ from the government regulatory network, such as:
- Air quality can vary within short distances, so data from the larger number of community monitors may measure and show these differences better than the relatively few government monitors.
- Government monitors may measure other air pollutants besides PM, such as ozone, which may influence the overall air quality levels reported for these monitors. The community monitors used in Imperial only measure PM.
- While we do our best to ensure that the community monitors are functioning, from time to time a community monitor may require maintenance or stop reporting data.
- IVAN Air Monitoring reports data as Community Air-Quality Levels (CALs), which are slightly different from the Air Quality Index (AQI) reported by government monitors.
We recommend that users of IVAN Air Monitoring also look at the regional air quality reported by the government network.
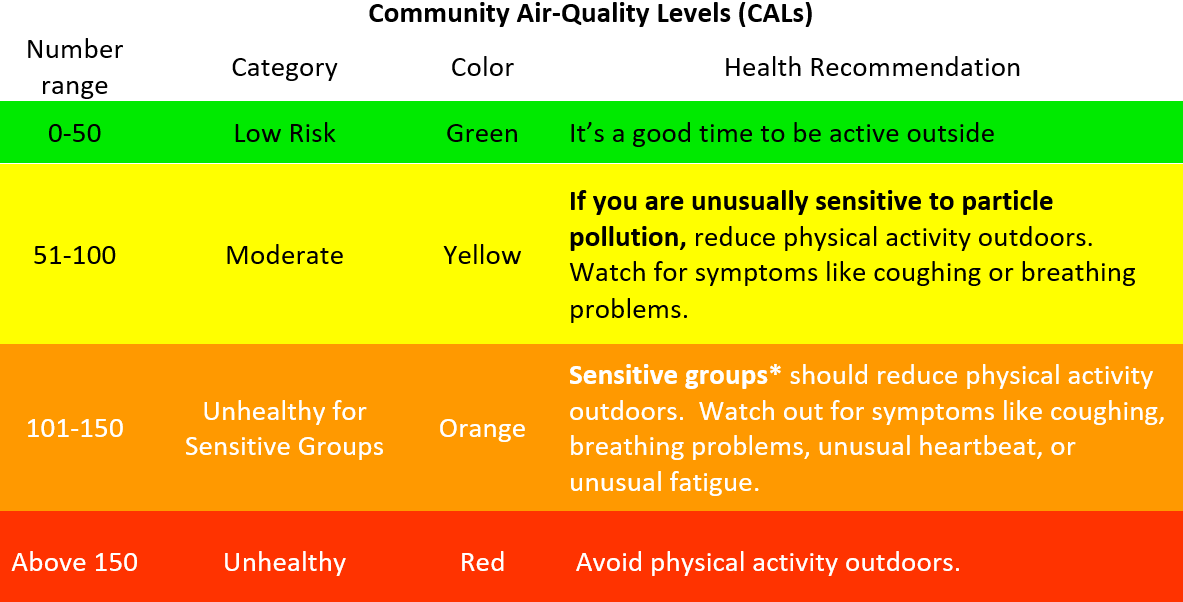
*Sensitive groups include children, teens, older adults, pregnant women, and people with heart, lung, or other chronic diseases
However, there are some differences to be aware of. While our CALs are calculated using the same method as the AQI, the air monitoring data come from a different type of monitor that performs slightly differently.
Furthermore, CALs do not contain categories beyond the unhealthy/red category, since we recommend that everyone take precaution when air pollution reaches that level of risk. This also aligns with the categories used by school flag programs in Imperial County.
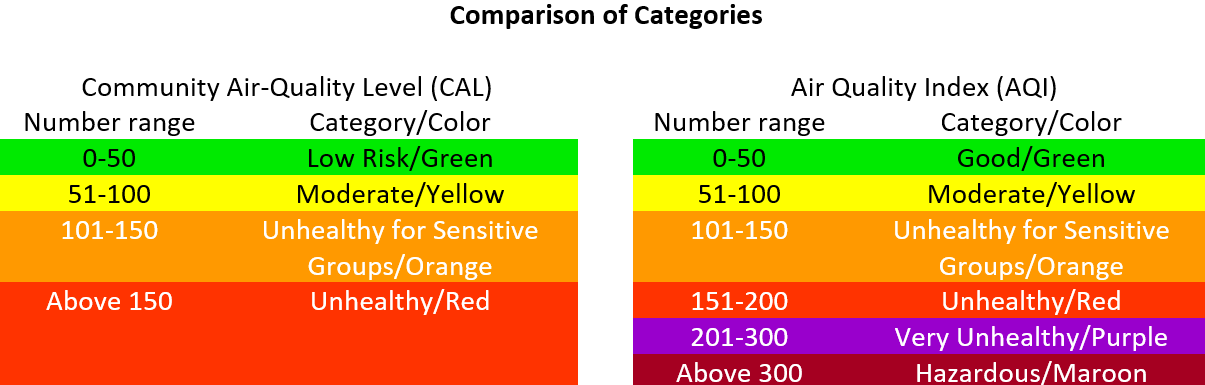
We recommend that users also pay attention to government-reported air quality when examining community air monitoring data from this website, though there are important reasons why these data may differ. When in doubt, we recommend taking precaution and action based on the highest of the air quality readings that you are comparing.
Air quality and health
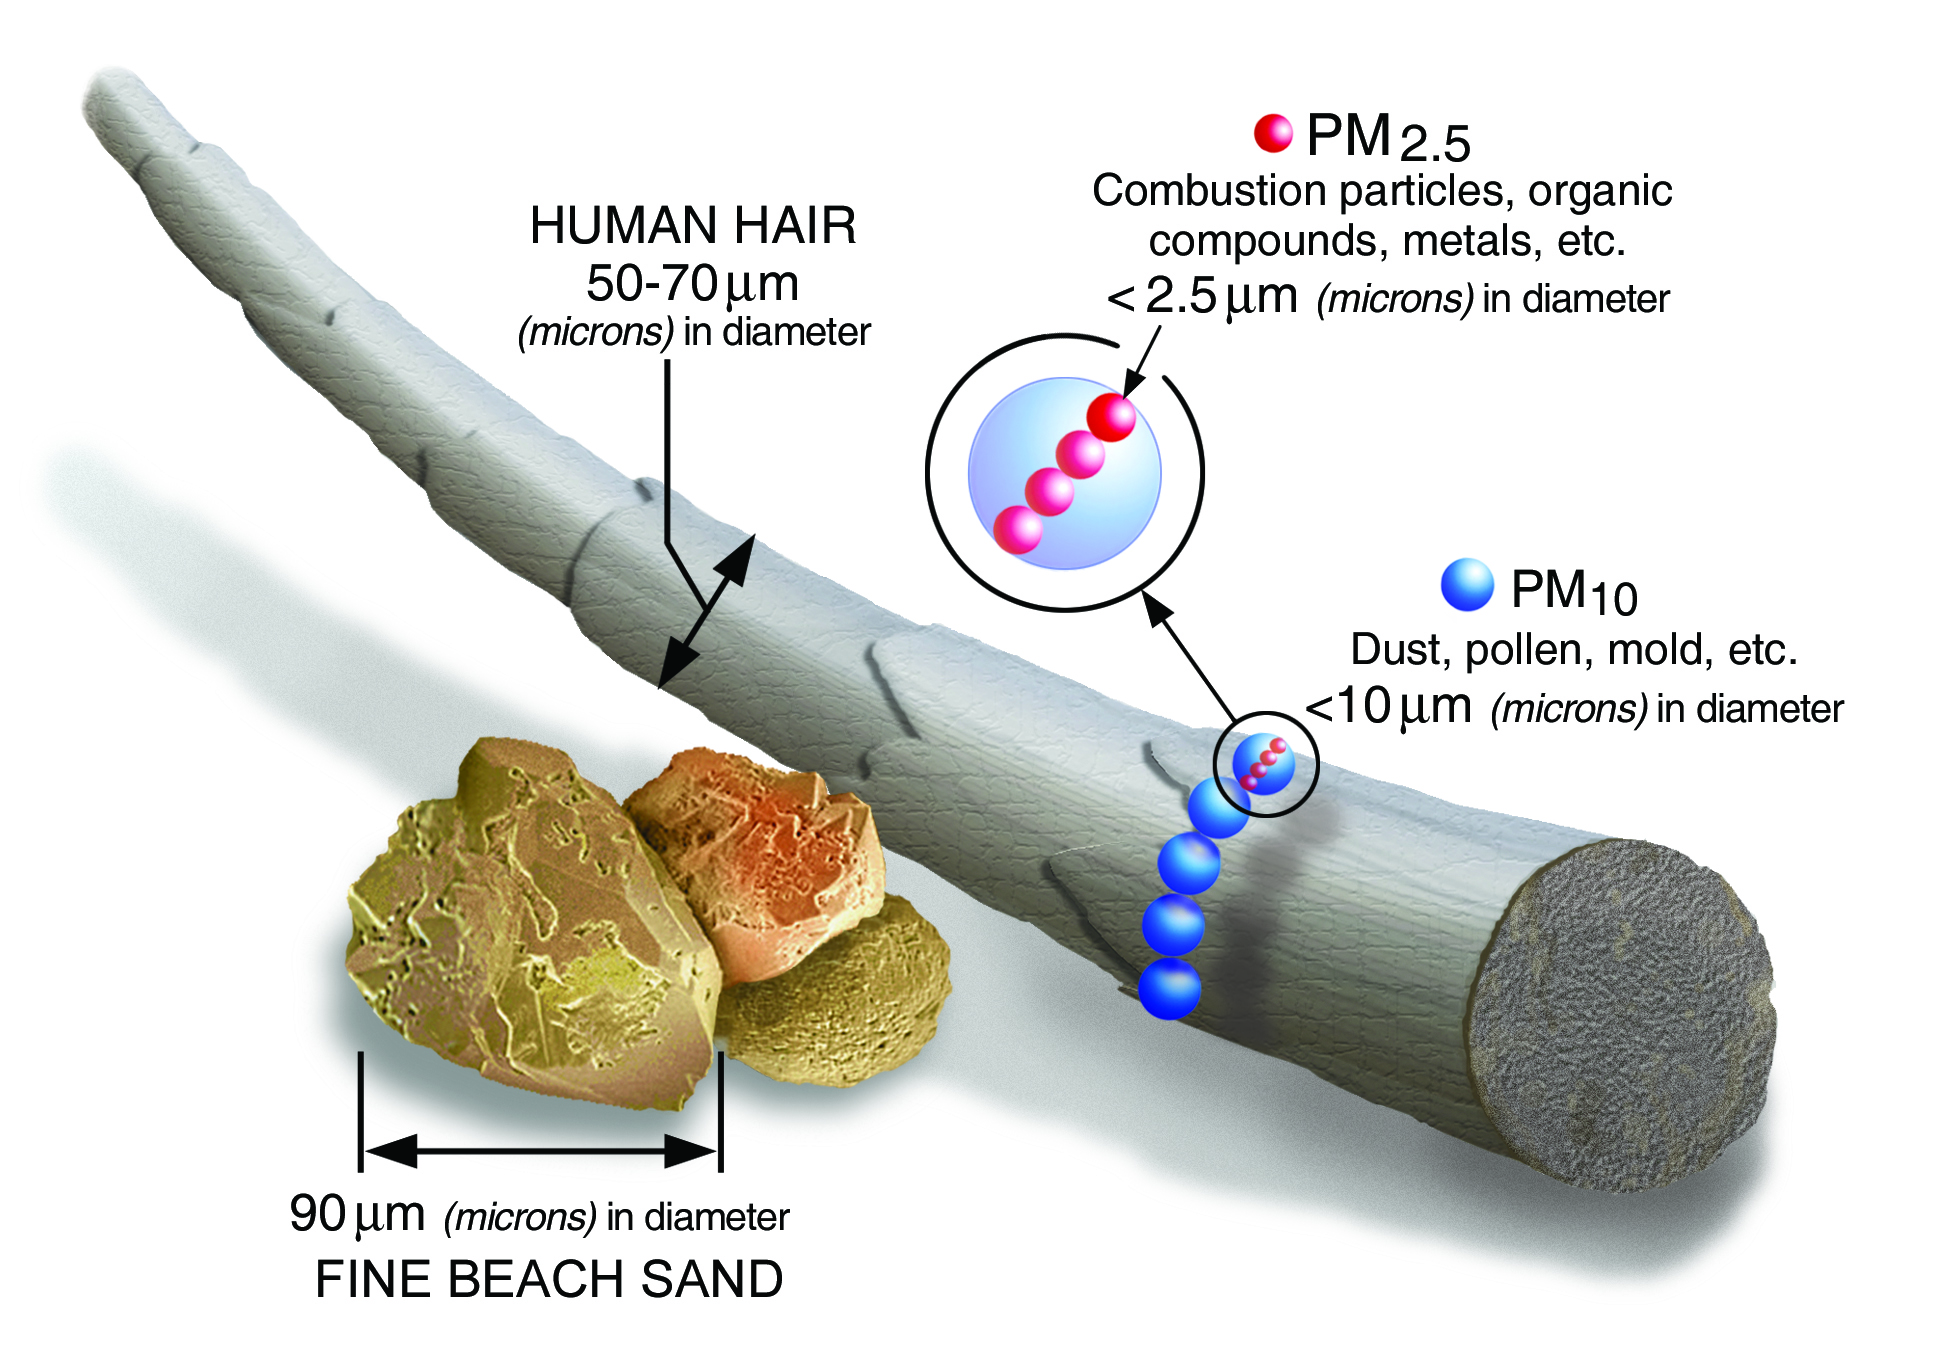
Image from EPA Particulate Matter Basics webpage
IVAN Air Monitoring reports on two categories of particles called PM10 and PM2.5. PM10 are particles that are less than 10 micrometers (µm) across (about seven times thinner than a human hair). PM2.5 are particles that are 2.5 micrometers or smaller, and these are also included in PM10.
We are concerned about PM10 and PM2.5 because they can be inhaled deep into the lungs and have been shown to harm health. Particles bigger than 10 micrometers can irritate your eyes, nose and throat, but do not usually reach your lungs.
If you have a lung disease, such as asthma: Being exposed to PM pollution for short periods of time like hours or a few days can make lung disease worse, cause asthma attacks, cause bronchitis, and make it easier to get respiratory infections. If PM levels are high:
- You may not be able to breathe as deeply or strongly as normal
- You may cough more, have chest pain, wheeze, feel like you can’t catch your breath, and be tired more than usual
- Follow your asthma management plan if you have asthma
If you have a heart disease: Being exposed to PM pollution for short periods of time like hours or a few days can cause irregular heartbeat or heart attacks. If PM levels are high:
- Serious problems-such as a heart attack- can happen in a short period of time without any warning signs. If you think you are having a heart attack, call 9-1-1 immediately.
- Symptoms like chest pain or tightness, fast heartbeat, feeling out of breath, and feeling tired more than usual may be signs of a serious problem. If you have any of these symptoms, follow your doctor’s advice and contact your doctor if they last longer than usual or get worse.
If you are pregnant: Short-term exposure to PM among pregnant women has been associated with giving birth too early and having babies that are too small. Pregnant women should try to reduce exposure to high levels of PM as much as possible.
Short-term exposure to PM has also been linked with premature death, usually in people who already have a serious health problem like lung or heart disease. Healthy children and adults usually do not have serious problems from short-term exposure to PM. They may have minor problems, like a scratchy throat or scratchy eyes when PM levels are elevated.
- Breathing problems
- Reduced lung function
- Chronic bronchitis
- Heart disease
- Lung cancer
These problems may lead to more hospital stays, more emergency department visits, and even premature death. Sensitive people such as older adults, people with diseases like asthma or congestive heart disease, and children are more likely to be affected by contact with PM.
When particulate matter (PM) levels in the air are very high, everyone can reduce their exposure by spending less time outdoors and reducing physical activity levels (e.g. walking instead of running). You can also plan your daily activities to reduce exposure to PM. For example, exercise away from roads, highways, or other sources of PM, especially if you are in a group at high risk of having health problems from PM pollution.
- Motor vehicles
- Dust from construction, landfills, and agriculture
- Wildfires and brush/waste burning
- Industrial sources
- Windblown dust from open lands
- Wood burning stoves and fireplaces
In Imperial County, PM sources of concern include dust from the Salton Sea, agricultural production including feed lots, vehicle traffic near the border crossing and on unpaved roads, and the burning of trash and agricultural biomass.
PM also forms when gases emitted from motor vehicles and industry undergo chemical reactions in the atmosphere. This is called secondary particulate matter.
Technical information
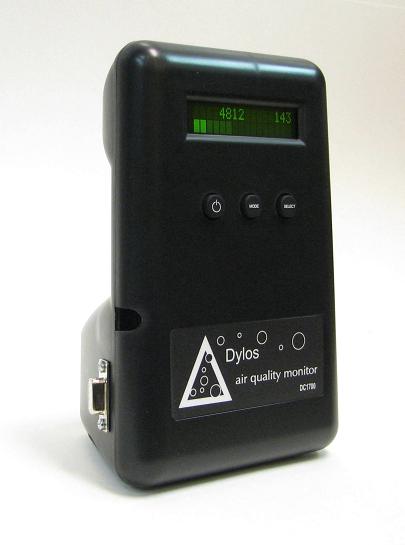
We have found similar correlations comparing Dylos data against data from a co-located Tapered Element Oscillating Microbalance (TEOM) PM instrument operated by the Imperial Irrigation District (IID) in the northern part of Imperial County.
Finally, the South Coast Air Quality Management District has done an independent evaluation of the Dylos and found very good agreement (R2=0.8) between the Dylos and a Federal Equivalent Monitor.
Step 2: Calculate concentrations: The particle mass results (in µg/m3) are averaged using the U.S. EPA NowCast method. The NowCast method produces a value for PM10 and PM2.5, which is an average of the previous 12 hours. If the air quality that day is stable, then the hours are weighted more evenly (approaching a 12‐hour average). If the air quality that day is changing, then recent hours are weighted more heavily (approaching an average of the most recent 3‐hours).
Step 3: Convert to Community Air-Quality Level: The resulting NowCast value (in µg/m3) is then converted to the Community Air-Quality Level (CAL) using the U.S. EPA Air Quality Index calculation method. CALs are categorized into 4 categories: green/low risk (0-50), yellow/moderate risk (51-100), orange/unhealthy for sensitive groups (101-150), and red/unhealthy (above 150). The 30-day and 90-day summary statistics for CALs are calculated using 24-hour AQIs.
After analyzing the data from these initial 20 monitors, we identified locations where additional air quality data was needed in order to fill in gaps in the monitoring network. Working with the CSC, we identified sites within these areas and are installing more monitors to complete the network.
Monitors at Torres-Martinez Reservation, State Park Road near Parkside Drive (in North Shore) and Oaxaca and Calle Villahermosa (in Mexicali) were added to the network with separate funding from the California Department of Public Health.
Getting involved
Other information and resources
The California Air Resources Board (ARB) is responsible for regulating air quality in California and monitors the regulatory activities of California’s local air districts. To monitor PM and other air pollutants, ARB uses a network of more than 250 air monitors in California. ARB operates some air quality monitors directly, while others are operated by local authorities, private contractors, and the National Park Service. The data collected by these government monitors are used to determine which areas meet state and national air quality standards.
The Imperial County Air Pollution Control District is one of 35 local air districts in California. Local air districts have primary responsibility for controlling air pollution from stationary sources.
After contacting the APCD, we recommend that you also submit a record of the problem here on IVAN Imperial, including a note that APCD has been contacted. This ensures that the Environmental Justice Task Force- a group of community and government representatives that meet monthly to review and take action on reports submitted through IVAN Imperial- is aware of the complaint and that the complaint is documented on the IVAN Imperial website.